LEAN MEAT AND POULTRY, FISH, EGGS, TOFU, NUTS AND SEEDS AND LEGUMES/BEANS
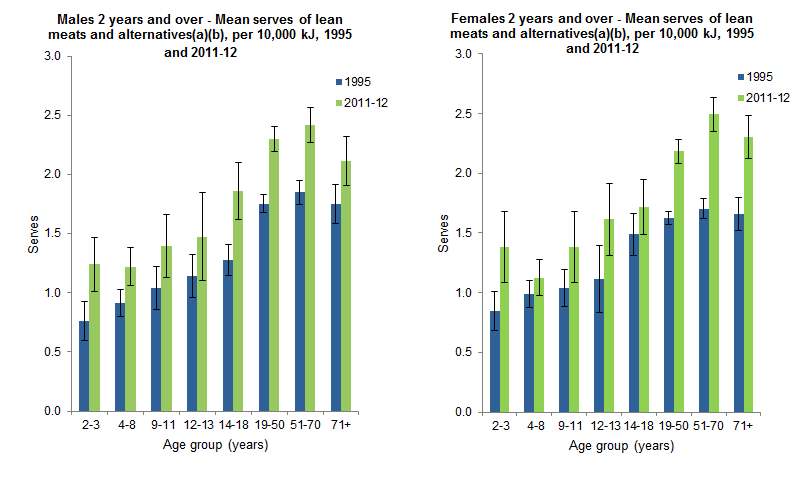
In 2011-12, the average daily consumption of foods from the lean meat1 and poultry, fish, eggs, tofu, nuts and seeds and legumes/beans group was 2.1 serves per 10,000 kJ, an increase of 36% on the 1995 average of 1.6 serves per 10,000 kJ. The increase occurred in each age and sex group, although the largest increase was seen among women aged 51-70 years, whose average serves per 10,000 kJ, increased from 1.7 to 2.5, making them the highest consumers of this food group on a per kJ basis.

(a) From non-discretionary sources, Based on Day 1. See Glossary for definition.
(b) Includes lean meat and poultry, fish, eggs, tofu, nuts and seeds and legumes/beans.
Sources: National Nutrition and Physical Activity Survey, 2011-12 and National Nutrition Survey, 1995
Around half of the increase in the lean meat and poultry, fish, eggs, tofu, nuts and seeds and legumes/beans has come from an increase in lean poultry consumption which almost doubled (from 0.34 to 0.62 serves per 10,000 kJ), to make up 29% of the group in 2011-12 (up from 22% in 1995). While consumption of lean red meat also increased (from 0.77 to 0.81 serves per 10,000 kJ), as a share of the overall group it dropped from 49% in 1995 to 38% in 2011-12 due to greater increases in consumption in the other food groups (as well as poultry). These included fish and seafood (up from 0.13 serves to 0.21 serves per 10,000 kJ over the 1995 to 2011-12 period), nuts and seeds (from 0.14 to 0.24 serves per 10,000 kJ), eggs (0.10 to 0.13 serves per 10,000 kJ) and legumes (0.08 to 0.10 serves per 10,000 kJ).

(a) From non-discretionary sources, Based on Day 1. See Glossary for definition.
(b) Includes lean meat and poultry, fish, eggs, tofu, nuts and seeds and legumes/beans.
Sources: National Nutrition and Physical Activity Survey, 2011-12 and National Nutrition Survey, 1995
Discretionary forms of meat
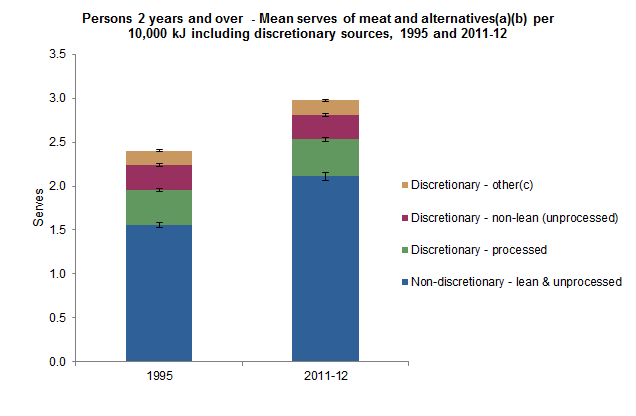
The proportion of all serves of meats, poultry, fish, eggs, nuts, seeds and legumes consumed that were defined as “discretionary” decreased from 36% in 1995 to 31% in 2011-12. The discretionary balance comprises processed meats (such as bacon, ham and salami), non-lean meats (>10% total fat) and lean meats that were contained within a discretionary food (e.g. chicken pie, battered deep fried fish etc). The average consumption of processed meat and non-lean meat was similar in both 1995 and 2011-12 (0.68 and 0.70 serves per 10,000 kJ respectively), but as a share of the total meats and alternatives food group, the non-lean and processed meats fell from to 29% to 25% due to the increased consumption of the non-discretionary forms.

(a) Based on Day 1. See Glossary for definition.
(b) Includes meat, poultry, fish, eggs, nuts, seeds and legumes/beans.
(c) Includes foods such as deep fried battered fish, chicken in a pie and nuts within chocolate.
Sources: National Nutrition and Physical Activity Survey, 2011-12 and National Nutrition Survey, 1995
ENDNOTES
 Print Page
 Print All